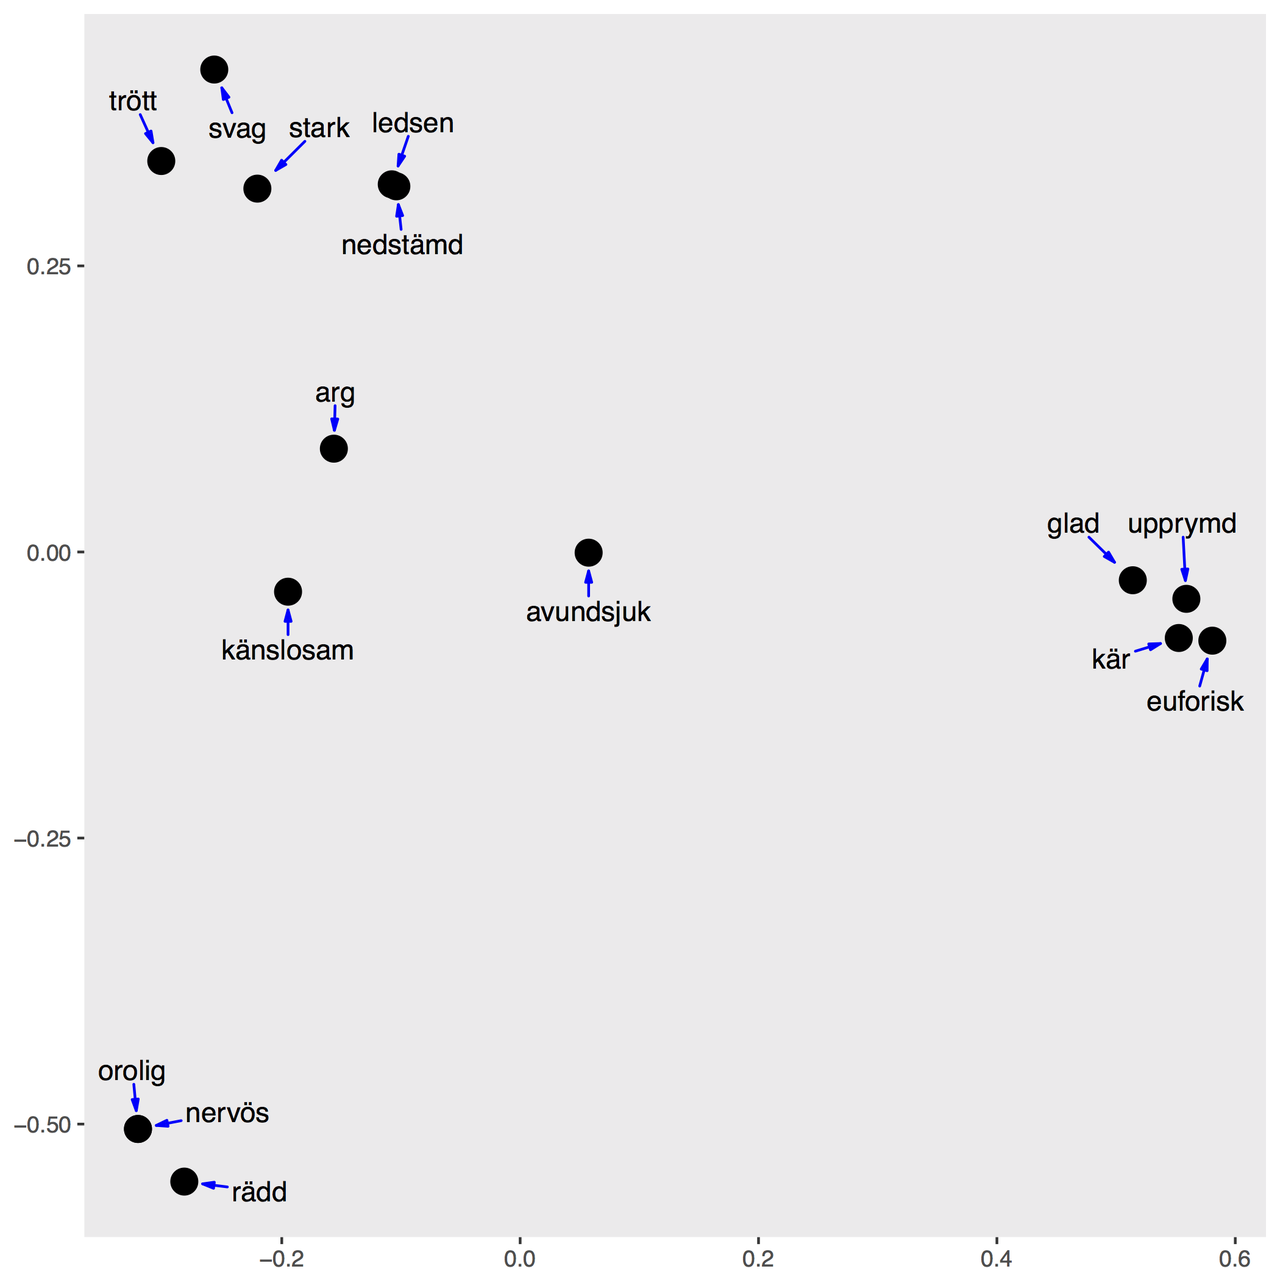
Presenting the results of a sorting task with MDS
Pile sorting
One good way to get at categorisation with relatively small numbers of responses is using a pile sorting task. Take your list of terms and write them out clearly on cards, one per card. Run the task with at least 5 people, preferably more.
Lay the cards out in front of the participant, and ask them to sort the cards into piles, as many as they think are necessary. Once they've finished, ask them if they have a label in mind for each piles and note it down if they do (don't press: use "group 1", "group 2", etc. if they haven't got labels). With each label list of all the terms in the pile.
Visualise the categorisation of the data
Thanks to Anna Sjöberg for sharing her example data of Swedish emotion verbs
To produce a nice MDS plot of this data:
-
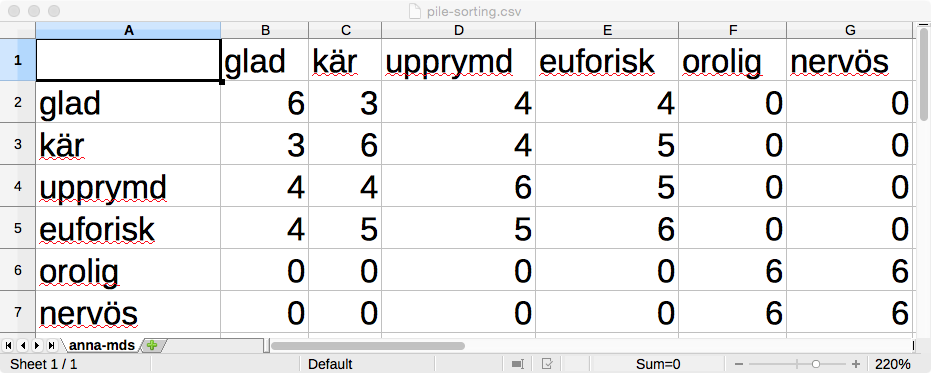
Make a similarity matrix in excel. The labels of the rows and the columns should be the exact terms used in the sorting task. For example:
-
Each cell is the intersection of a row label and a column label. In the cell write the number of participants who put the two terms in the same pile.
Write zero if nobody put them in the same pile
The diagonal contains the number of times a term was in the same group as itself, which by definition is the same as the number of participants.
The matrix is symmetrical, so each number can be entered twice, although the script will also work if you just fill out the lower triangle, i.e. numbers below the diagonal.
Save the file as tab-separated values (open it in a text editor and check it's not using commas, semicolons, etc.)
The following script makes the MDS plot. It is run in the terminal, using the
R statistical programming language. If you're
using a unix system and you know how you can make this script executable and
add it to your PATH. Otherwise you can run it with Rscript --vanilla
similarity2MDS. Note that ggplot2 and grepel are not part of R by default:
they have to be installed separately.
#!/usr/bin/env Rscript --vanilla
USAGE ="Usage: similarity2MDS CSVFILE OUTFILE
Take a tab delimited csv file with similarity matrix data and output a pdf with
2D MDS. The similarity matrix may be square or lower triangular
"
library(ggplot2)
library(ggrepel)

args <- commandArgs(TRUE)
if (any(grep("^(--help|-h)$", args), is.na(args[1]))){
  cat(USAGE)
  quit("no", 1)
  }
stopifnot(length(args) == 2)

data.sim <- as.dist(read.delim(args[[1]], row.names=1, header=TRUE))
data.dist <- 1 - (data.sim/max(data.sim))
fit <- as.data.frame(cmdscale(data.dist, k=2))
names(fit) <- c("x", "y")
pdf(args[[2]], width=7, height=7)
ggplot(data=fit) + geom_point(aes(x, y, size=3)
                  ) + geom_text_repel(
                              aes(x, y, label=rownames(fit)),
                              segment.color="blue",
                              arrow = arrow(length = unit(0.01, 'npc'),
                                            angle=15,
                                            type='closed'),
                              box.padding = unit(0.3, "lines"),
                              point.padding = unit(1.0, "lines")
                  ) + theme(legend.position = "none",
                              axis.title.x = element_blank(),
                              axis.title.y = element_blank(),
                              panel.grid.minor=element_blank(),
                              panel.grid.major=element_blank()
                  )
dev.off()

# If you're using MacOSX, the following line will automatically open the plot once it's made
# system(paste("open", args[[2]]))